Background
OpenTelemetry is quickly becoming the industry standard for observability, but in my opinion its uptake in the .NET world has been slow compared to other languages.
Grafana Loki is a robust system designed for storing, aggregating, and querying logs. It integrates well with OpenTelemetry and the Grafana dashboard, which we will use to visualise these logs.
Here I will describe how you can configure your .NET application to log to the OpenTelemetry collector and from there, ship those logs to Loki to visualise them in Grafana.
We’ll use Docker to run our application in a production-like environment.
Bootstrapping
First, let’s scaffold our dotnet application using the webapi template:
dotnet new webapi -o ./Api
Our Program.cs should look something like this:
var builder = WebApplication.CreateBuilder(args);

// Add services to the container.
// Learn more about configuring Swagger/OpenAPI at https://aka.ms/aspnetcore/swashbuckle
builder.Services.AddEndpointsApiExplorer();
builder.Services.AddSwaggerGen();

var app = builder.Build();

// Configure the HTTP request pipeline.
if (app.Environment.IsDevelopment())
{
    app.UseSwagger();
    app.UseSwaggerUI();
}

app.UseHttpsRedirection();

var summaries = new[]
{
    "Freezing", "Bracing", "Chilly", "Cool", "Mild", "Warm", "Balmy", "Hot", "Sweltering", "Scorching"
};

app.MapGet("/weatherforecast", () =>
{
    var forecast =  Enumerable.Range(1, 5).Select(index =>
        new WeatherForecast
        (
            DateOnly.FromDateTime(DateTime.Now.AddDays(index)),
            Random.Shared.Next(-20, 55),
            summaries[Random.Shared.Next(summaries.Length)]
        ))
        .ToArray();
    return forecast;
})
.WithName("GetWeatherForecast")
.WithOpenApi();

app.Run();

record WeatherForecast(DateOnly Date, int TemperatureC, string? Summary)
{
    public int TemperatureF => 32 + (int)(TemperatureC / 0.5556);
}
We’ll need something to generate logs for us that we can ship to Loki, ideally without us having to manually interact with the application. We can achieve this easily with a background service. Let’s create one:
touch Api/Worker.cs
And add the following class:
namespace Api;

public class Worker : BackgroundService
{
    private readonly ILogger<Worker> _logger;

    public Worker(ILogger<Worker> logger)
    {
        _logger = logger;
    }

    protected async override Task ExecuteAsync(CancellationToken stoppingToken)
    {
        while (!stoppingToken.IsCancellationRequested)
        {
            _logger.LogInformation("Worker running at: {time}", DateTimeOffset.Now);
            await Task.Delay(1000, stoppingToken);
        }
    }
}
We’ll add the namespace in a using statement and register the background service with the our application in Program.cs like so:
| |
Now when we run out application we should see logs generated automatically:
$ dotnet run --project Api/
Building...
info: Api.Worker[0]
     Worker running at: 06/12/2024 19:49:05 +01:00
info: Microsoft.Hosting.Lifetime[14]
     Now listening on: http://localhost:5249
info: Microsoft.Hosting.Lifetime[0]
     Application started. Press Ctrl+C to shut down.
info: Microsoft.Hosting.Lifetime[0]
     Hosting environment: Development
Docker setup
At this point we should start thinking about Dockerizing our application:
touch ./Api/Dockerfile
and populate it:
FROM mcr.microsoft.com/dotnet/aspnet:8.0-alpine AS base
USER app
WORKDIR /app
EXPOSE 8080
EXPOSE 8081

FROM mcr.microsoft.com/dotnet/sdk:8.0 AS build
ARG BUILD_CONFIGURATION=Release
WORKDIR /src
COPY ["./Api.csproj", "./Api/"]
RUN dotnet restore "./Api/Api.csproj"
COPY . ./Api
WORKDIR "/src/Api"
RUN dotnet build "./Api.csproj" -c $BUILD_CONFIGURATION -o /app/build

FROM build AS publish
ARG BUILD_CONFIGURATION=Release
RUN dotnet publish "./Api.csproj" -c $BUILD_CONFIGURATION -o /app/publish /p:UseAppHost=false

FROM base AS final
WORKDIR /app
COPY --from=publish /app/publish .
ENTRYPOINT ["dotnet", "Api.dll"]
Let’s start to build up our compose file in the root of our project:
touch docker-compose.yaml
and populate it with the configuration required to run out application and expose port 8080:
services:
  api:
    build:
      context: ./Api
    ports:
      - 8080:8080
We should be able to run our application in docker with the following command:
docker compose -f ./docker-compose.yml up
OpenTelemetry Collector
Let’s start to configure the OpenTelemetry Collector. The collector acts as a proxy for signals, allowing you to decouple your application from the various telemetry processing vendors.
We’ll add the collector as a service in our compose file, but first we need a basic configuration that we can mount into it:
mkdir ./otel-collector && touch ./otel-collector/otel-config.yml
receivers:
  otlp:
    protocols:
      grpc:
      http:
        cors:
          allowed_origins:
            - "http://*"
            - "https://*"

exporters:
  debug:

processors:
  batch:

service:
  pipelines:
    logs:
      receivers: [otlp]
      processors: [batch]
      exporters: [debug]
The OpenTelemetry Collector is configured as a pipeline. Telemetry data is ingested by receivers and made available externally by exporters, with optional processors sitting in the middle. Our configuration will receive data in the otlp format and log it to the console with the debug exporter. The batch processor will group our logs before exporting them as a form of basic load-levelling.
OpenTelemetry Collector Contrib
As the Loki exporter doesn’t currently exist in the core OpenTelemetry repository, we’ll use the “contrib” image which has additional functionality not yet merged or otherwise inappropriate for the main repo. You can read more about it in its GitHub repo .
We can use the following in our compose file to mount our configuration and run the collector:
| |
Orchestration
If we run our compose file we should see the otel collector startup, but we do not expect any recurring activity while we aren’t actively shipping it logs. Let’s change that by adding the OpenTelemetry exporter NuGet package tools to our application.
cd ./Api
dotnet add package OpenTelemetry.Exporter.OpenTelemetryProtocol
Now let’s register the exporter in our application:
| |
If we run the application, we will see that nothing much else is happening. No logs appear to be sent to the collector. In order to wire everything up we’ll need to configure our application with the collector’s endpoint. We can do this by setting the OTEL_EXPORTER_OTLP_ENDPOINT environment variable in our app container’s compose configuration:
| |
Spinning up our compose configuration should now result in the otel-col container periodically logging the following:
otel-col | 2024-06-12T20:08:58.725Z info LogsExporter {"kind": "exporter", "data_type": "logs", "name": "debug", "resource logs": 1, "log records": 5}
This the the debug exporter we configured earlier.
Grafana & Loki
Now that we have an application producing logs and shipping them to our OpenTelemetry collector we can work on sending them on to Loki and visualising them in Grafana. To do this we’ll set up both Loki and Grafana in our compose file:
| |
To make things easy for ourselves we’ll add two configuration files for Grafana. A grafana.ini which will configure anonymous access, as well as a datasources.yaml to automatically link the instance to our Loki container.
From our project directory:
mkdir ./grafana && mkdir ./grafana/datasources
touch ./grafana/grafana.ini
touch ./grafana/datasources/datasources.yml
Populate the files as such:
grafana.ini
[paths]
provisioning = /etc/grafana/provisioning

[server]
protocol = http
http_port = 3000
domain = localhost
serve_from_sub_path = true

[auth]
disable_login_form = true
[auth.anonymous]
enabled = true
org_name = Main Org.
org_role = Admin
For brevity I’ve removed the comments usually found in the grafana.ini. If you wish to learn more about configuring Grafana you kind find information here .
datasources.yml
apiVersion: 1
datasources:
- name: Loki
  type: loki
  access: proxy
  orgId: 1
  url: http://loki:3100
  basicAuth: false
  isDefault: true
  version: 1
  editable: false
Sending logs from otel-col to Loki
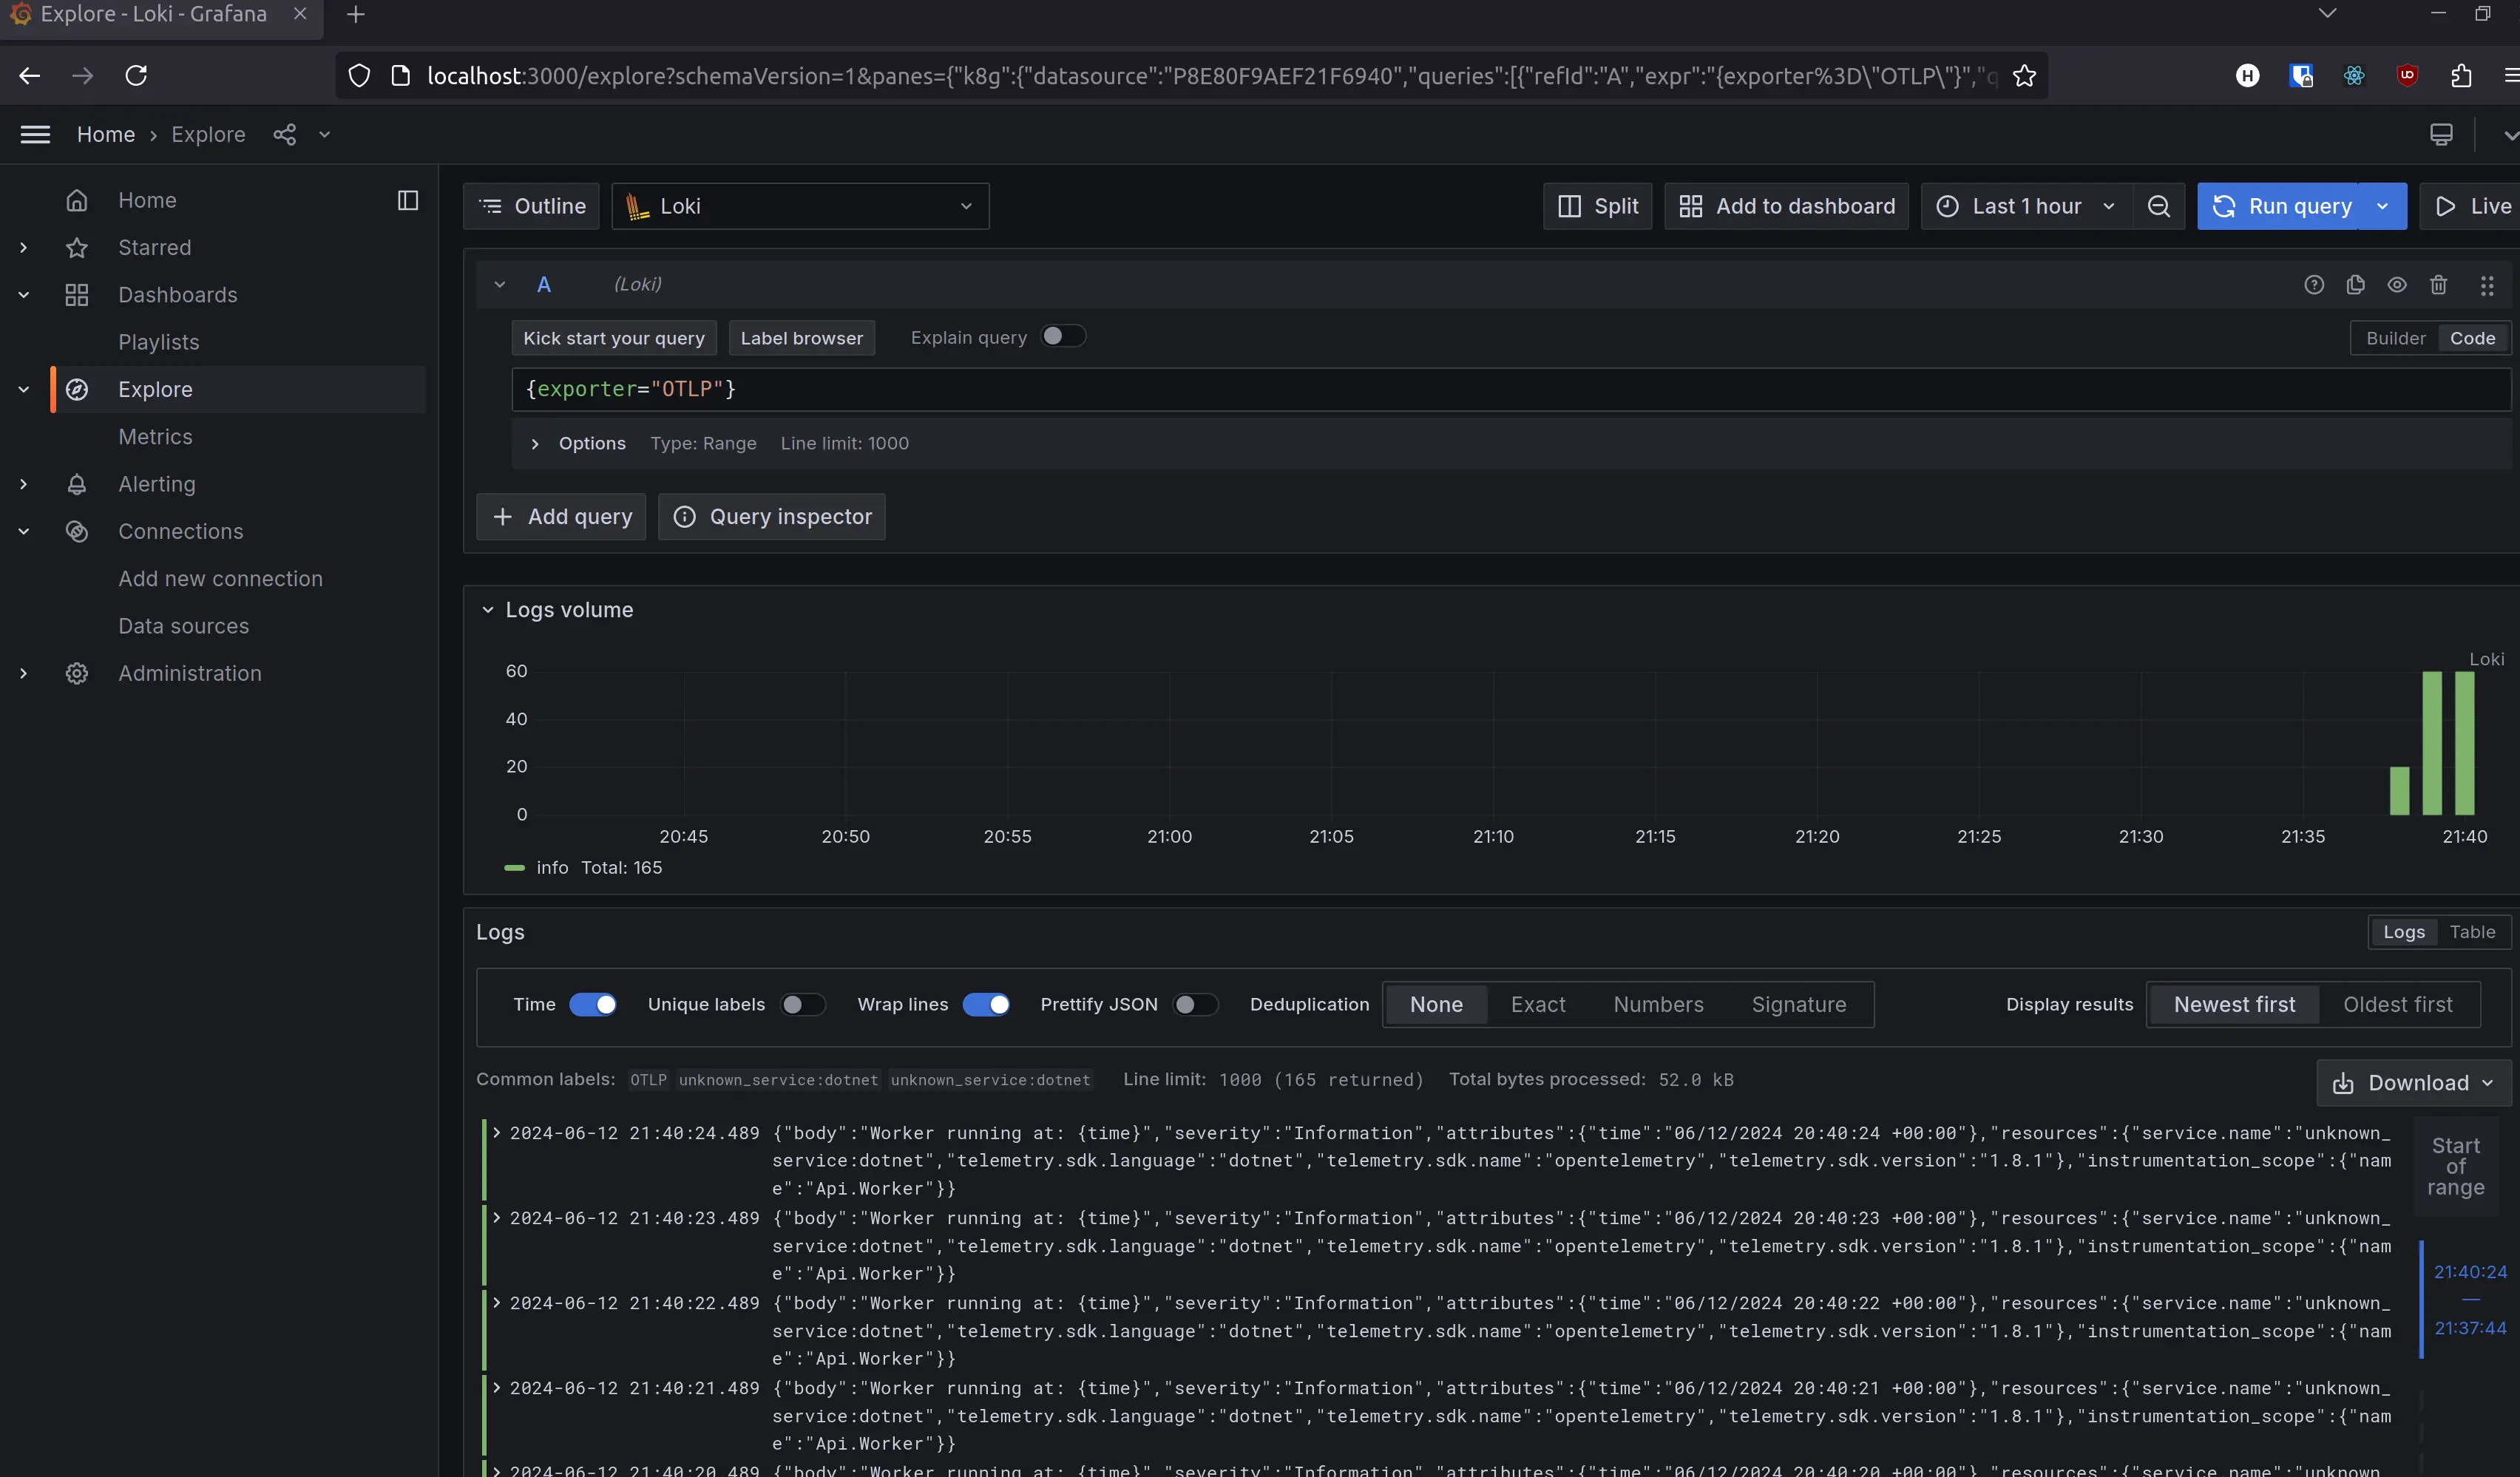
Now if we run our compose file we will the Loki and Grafana containers running. The Grafana portal should be available at http://localhost:3000. If you use the sidebar to navigate to Connections > Data sources you should see our Loki instance. Click explore to navigate to the query builder. At this stage you won’t be able to find any of our logs, as they are still only present on the OpenTelemetry collector. Let’s adjust its config to ship logs onto Loki.
In the otelcol-config.yml, add the loki exporter and register it in the pipeline:
| |
Running the compose configuration should now produce similar output, but if you navigate to the data source explorer in Grafana you should be able query for some logs. Simply filtering for {exporter="OTLP"} should yield the logs from your application.
Conclusion
In this post we covered the most basic steps required to configure a dotnet application to ship logs to the OpenTelemetry application, followed by visualising them in Grafana. We didn’t cover any details on application logging considerations, or strategies for configuring and querying Loki in a scalable manner. I encourage you to look into this yourself and find what best works for your projects and team.